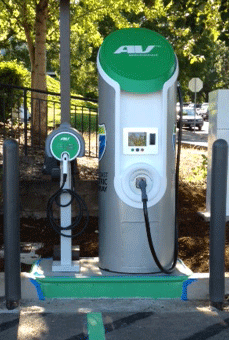
Like electric vehicles? You’re in good company. There are now more than 200,000 electric vehicles on the road in this country, with many more projected to follow suit. Via the Portland Tribune: [A new report from the Environment Oregon Research and Policy Center] titled “Driving Cleaner: More Electric Vehicles Mean Less Pollution,” found there are already more […]
NW Natural: Expanding our Fuel Infrastructure
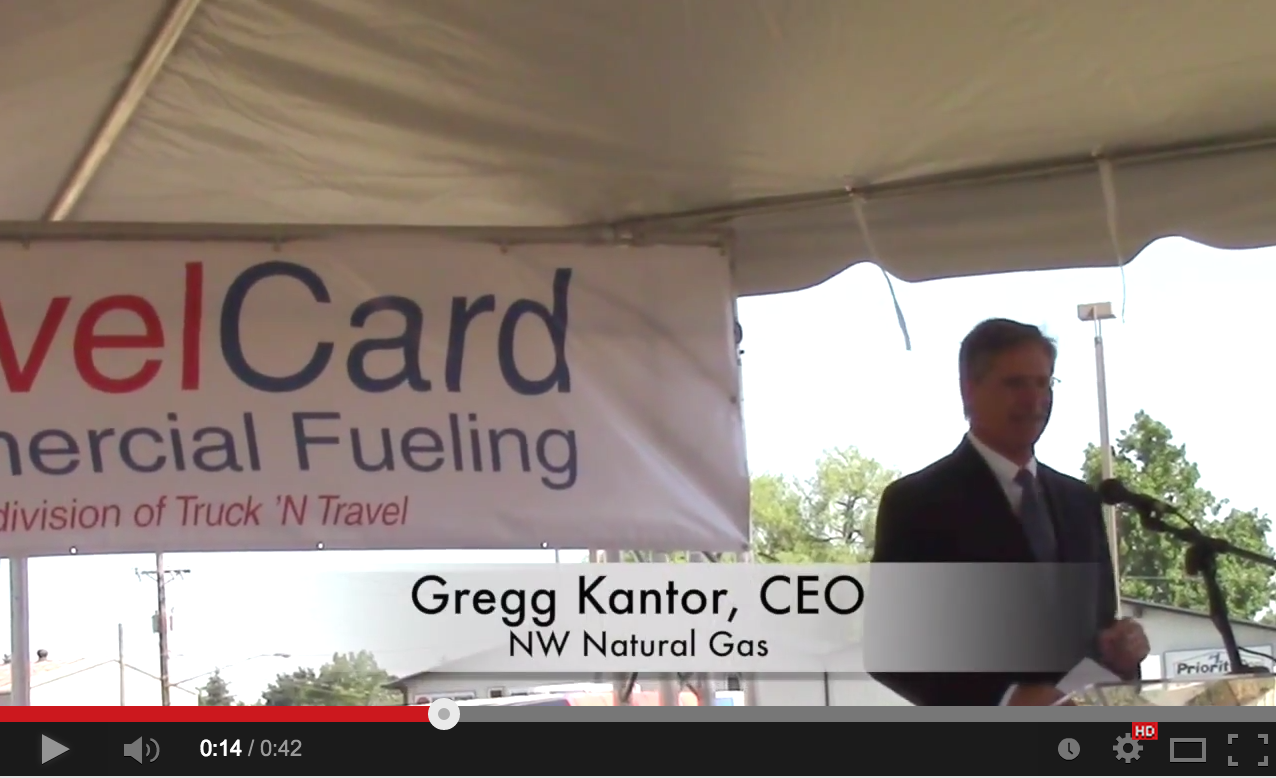
NW Natural and dozens of other businesses convened in Eugene last week, to celebrate the launch of Oregon’s first public natural gas fueling station. With the opening, Oregon adds natural gas to the list of fuel options available to Oregonians and our burgeoning clean fuel vehicle industry. Gregg Kantor, CEO of NW Natural, shared the incredible […]
Where can you fill up for $2.29/gallon?
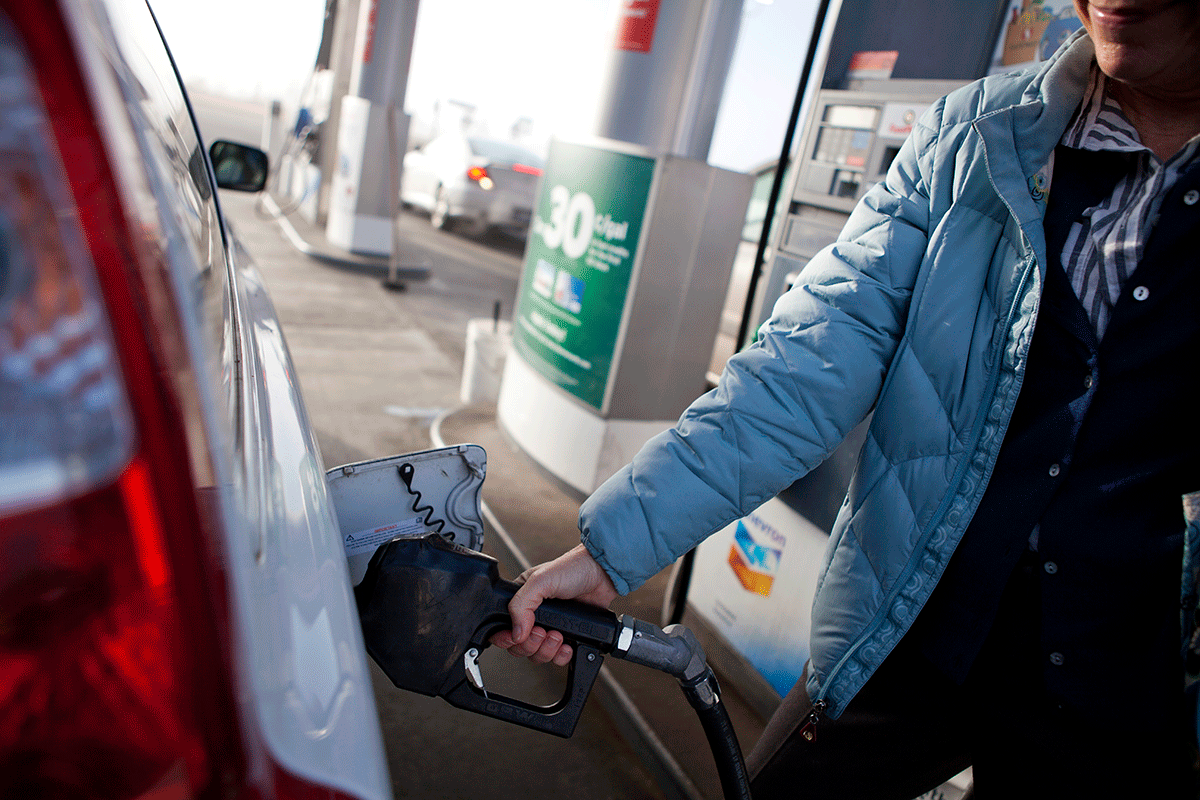
You’re not reading this wrong. Nor is the picture dated. Drivers really can fill up for $2.29/gallon at the Truck ‘N Travel in Eugene. There is one catch, though… … That’s the price for fueling up with cleaner-burning natural gas instead of gasoline or diesel. As gasoline and diesel prices spike headed into summer, it’s […]
Clean Fuels Hearing: The Highlights
Oregon is not the only state to recognize the benefits of a homegrown clean fuels industry to strengthen our economy, create jobs, and protect the environment. Our California and British Columbia neighbors have implemented their own Clean Fuels Programs and already started to reap the rewards from economic growth, job gains, and cleaner, more affordable fuel alternatives. Last week, Oregon lawmakers […]
Alternative Fuels Could Save Your Life
While Oregon continues to make progress on our own Clean Fuels Program, we’re always interested in what’s happening just south in California, where their own version of the program (the LCFS) has been in place for several years. Last week, the Atlantic ran a story on the considerable health benefits and economic savings from the reduction […]
How does Oregon stack up on carbon pollution?
This is neat! Georgetown Climate Center has built a map of state climate and energy policies, including (as shown below) the change in carbon pollution emissions that come from the power sector, from 2005-2012. The darker the green, the greater the reduction; the deeper the blue/purple, the higher of an increase. (Click the map to visit Georgetown’s site to play around with […]